| #project, #data-science | |||
Rocket Lab Telemetry From VideoUsing Google's OCR to Collect Rocket Launch Telemetry from a Live Stream |
|||
The Anomaly
Early today, Rocket Lab launched their 20th Electron rocket, Running out of Toes from their Launch Complex 1 Mahia Peninsula in New Zealand.
On one of our toughest days, our team operated with professionalism and worked swiftly to ensure the anomaly was managed safely. Our team is resilient, and our top priority remains to safely and reliably return to flight for our customers. We will learn from this, and we’ll be back on the pad again. —Peter Beck, Rocket Lab founder and chief executive
Unfortunately, the mission ended in failure right around T+00:02:30 shortly after main engine cutoff and second stage separation. In the live stream, the second stage appears to ignite and then quickly cutoff.
Rocket Lab released a statement confirming that the anomaly had lead to the failure of the mission, but not yet releasing any preliminary data that might point to the cause of the failure, of course, pending the investigation.
Days like today are a magnet for armchair engineers…
The Data
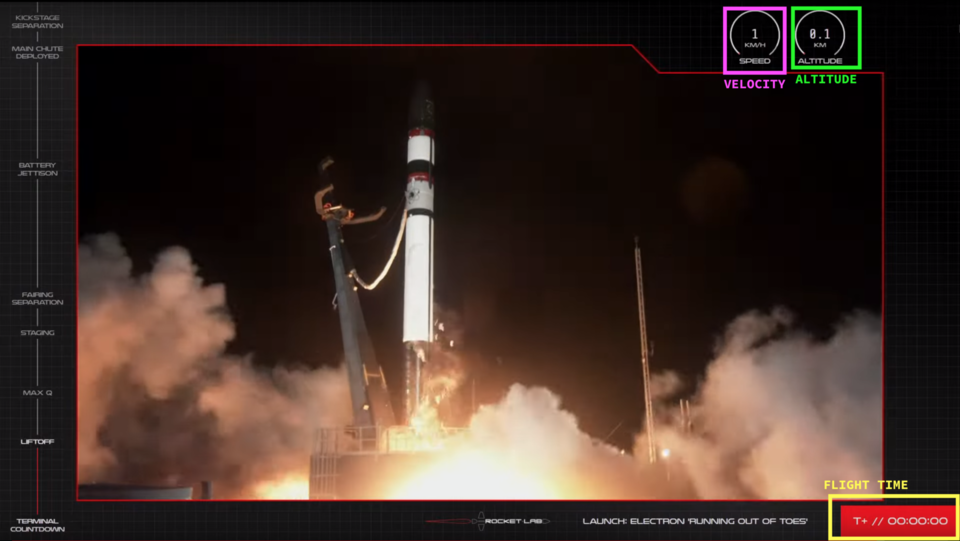
This is a single frame from the live stream right at T-00:00:00. On the right hand side, you can see that they helpfully show some telemetry: flight time, speed, and altitude, along with the video feed itself, and some stages or “gates” on the left hand side.
When wanting to figure out what happened, besides the video, this was all the data we in the peanut gallery had.
So, I did what any sane person would do and started going frame by frame to record the telemetry by hand in a spreadsheet. After I realized that the area of interest was about three minutes and thirty second long, and the stream was at 30 frames/second, I was looking at transcribing thousands of frames! Given that the data wasn’t really updating every single frame, the number was likely to be a lot lower, but still… The band of DIY rocket scientists were waiting; this couldn’t take all day!!
I pulled the video down using youtube-dl just in case the video was taken down from Youtube. Rocket Lab isn’t known to do this, but SpaceX, for example, de-lists their videos and they can be difficult to find.
$ youtube-dl https://www.youtube.com/watch?v=Zw3sIUyfSfc
Google Video Intelligence API
Luckily, this is the exact kind of job that neural networks are suited for. In fact, the first algorithms you learn about are ones used for handwritten digit recognition. These weren’t even handwritten, so the job could end up being quite easy! One challenge was that we’re dealing with thousands of frames, not just a single image. My personal toolkit doesn’t support analyzing video, so I reached for Google Cloud Video Intelligence API
This service uses OCR (Optical Character Recognition) to detect and extract text from video. Perfect!
After configuring and deploying the resources in my Google Cloud account. I uploaded the video to Google Cloud Storage and called the REST API
// request.json
{
  "inputUri": "gs://thomascountz/rocket-lab-20-launch-anomaly.mp4",
  "features": ["TEXT_DETECTION"],
  "videoContext": {
    "textDetectionConfig": {
      "languageHints": ["en-US"]
    }
  }
}
curl -X POST \
  -H "Authorization: Bearer "$(gcloud auth application-default print-access-token) \
  -H "Content-Type: application/json; charset=utf-8" \
  -d @request.json \
  https://videointelligence.googleapis.com/v1/videos:annotate
Data Cleanup/Presentation
What came back was exciting and a little unexpected. I guess I didn’t know what to expect (it’s not like I had read any documentation or anything).
Firstly, the API responds with a job name that then you can later use to query for the results and other metadata. I used that name to send another API request and I got back results almost instantly. The entire job took maybe 2 second to complete and I got something back like this:
{
  "name": "projects/REDACTED/locations/us-west1/operations/REDACTED",
  "metadata": {
    "@type": "type.googleapis.com/google.cloud.videointelligence.v1.AnnotateVideoProgress",
    "annotationProgress": [
      {
        "inputUri": "/thomascountz/rocket-lab-20-launch-anomaly.mp4",
        "progressPercent": 100,
        "startTime": "2021-05-15T15:39:55.442511Z",
        "updateTime": "2021-05-15T15:41:17.361940Z"
      }
    ]
  },
  "done": true,
  "response": {
    "@type": "type.googleapis.com/google.cloud.videointelligence.v1.AnnotateVideoResponse",
    "annotationResults": [
      {
        "inputUri": "/thomascountz/rocket-lab-20-launch-anomaly.mp4",
        "segment": {
          "startTimeOffset": "0s",
          "endTimeOffset": "218.100s"
        },
        "textAnnotations": [
          {
            "text": "2612",
            "segments": [
              {
                "segment": {
                  "startTimeOffset": "98.400s",
                  "endTimeOffset": "98.500s"
                },
                "confidence": 1,
                "frames": [
                  {
                    "rotatedBoundingBox": {
                      "vertices": [
                        {
                          "x": 0.7729167,
                          "y": 0.05277778
//... snip...
That’s a heavily truncated version, but the things I noticed were:
- The result was so big, I was having trouble exploring it all at once.
- The data was not in order by frame count the way a video is. This makes sense since OCR acts on a single image and Google Cloud most likely parallelized the work for each image before collecting it into a single result (fan-out/fan-in).
- There wasn’t an obvious way to tell which frames contained the data I cared about (time, speed, altitude) and for each frame, it wasn’t entirely clear which bit of text mapped to which data point (altitude and speed are both numbers).
1. The results were big
Ha! 1116879 lines of unminified JSON never hurt anyone! Although my computer choked on opening the response in something like vim, I used jq to begin to explore the data.
After getting an understanding for the shape, I actually “trimmed” of the pieces of data I didn’t care about by mapping through each textAnnotation and only keeping the text found and the start and stop timestamps. (This ended up making my life more difficult… More on this later.)
jq '.response.annotationResults[0].textAnnotations[] |= { text: .text, start: .segments[0].segment.startTimeOffset, end: .segments[0].segment.endTimeOffset }' response.json > response_trim.json
This produced something a little more manageable:
{
  "name": "projects/REDACTED/locations/us-west1/operations/REDACTED",
  "metadata": {
    "@type": "type.googleapis.com/google.cloud.videointelligence.v1.AnnotateVideoProgress",
    "annotationProgress": [
      {
        "inputUri": "/thomascountz/rocket-lab-20-launch-anomaly.mp4",
        "progressPercent": 100,
        "startTime": "2021-05-15T15:39:55.442511Z",
        "updateTime": "2021-05-15T15:41:17.361940Z"
      }
    ]
  },
  "done": true,
  "response": {
    "@type": "type.googleapis.com/google.cloud.videointelligence.v1.AnnotateVideoResponse",
    "annotationResults": [
      {
        "inputUri": "/rocket_lab_001/end-to-end-flight.mp4",
        "segment": {
          "startTimeOffset": "0s",
          "endTimeOffset": "218.100s"
        },
        "textAnnotations": [
          {
            "text": "2612",
            "start": "98.400s",
            "end": "98.500s"
          },
          {
            "text": "3467",
            "start": "110.300s",
            "end": "110.300s"
          },
          {
            "text": "1362",
            "start": "73s",
            "end": "73.100s"
          },
          {
            "text": "2392",
            "start": "94.800s",
            "end": "94.900s"
          },
          {
            "text": "2079",
            "start": "89.300s",
            "end": "89.300s"
          },
// ... snip ...
2. Data out of order
With the timestamps in place, the data being out of order was no longer an issue. I easily parsed the start value of each object into a float, and then sorted in ascending order.
Note that this was the time in seconds based on the video I uploaded to cloud storage which was only about three minutes of the hour+ Youtube stream.
3. Knowing what the text means for each timestamp
Now that things were sorted (pun intended), I had to then understand what each of the text values represented. For this, I moved to Ruby. (I told you that this was brute force data munging and worst practices. I hope you didn’t come here thinking I knew what I was doing).
In Ruby, I read in the trimmed file as a hash, removed the metadata, converted everything to floats, integers, and symbols, and grouped by the start timestamp.
Yes, there can be, and were, many annotations that started at the same time. Not all of the data on the video was updated in sync, especially because the flight time was only updated once per second, but the telemetry data was updated more often. (Thanks for the high fidelity Rocket Lab!).
I ended up with a hash that looked like this:
{
  # ...snip...
  205.6=>
   [{:text=>"7687", :start=>205.6, :end=>205.6},
    {:text=>"T+// OO:03:18", :start=>205.6, :end=>206.5}],
  205.7=>[{:text=>"7661", :start=>205.7, :end=>206.1}],
  206.3=>[{:text=>"7677", :start=>206.3, :end=>206.3}],
  206.4=>
   [{:text=>"110.0", :start=>206.4, :end=>207.8},
    {:text=>"7689", :start=>206.4, :end=>206.7}],
  206.6=>[{:text=>"T+// OO:03:19", :start=>206.6, :end=>207.5}],
  206.8=>[{:text=>"7676", :start=>206.8, :end=>206.8}],
  207.0=>[{:text=>"7656", :start=>207.0, :end=>207.0}],
  207.1=>[{:text=>"7647", :start=>207.1, :end=>207.2}],
  207.3=>[{:text=>"7649", :start=>207.3, :end=>207.3}],
  207.4=>[{:text=>"7657", :start=>207.4, :end=>207.4}],
  207.5=>[{:text=>"7669", :start=>207.5, :end=>207.5}]
  # ...snip...
}
Just taking a look at the :text values, we can see some integers, floats, and a string that starts with T+// ; this formatting happens to map to the speed, altitude, and flight time, respectively.
Remember earlier when I used jq to delete a bunch of data that I thought I didn’t need? It turns out that that data contained the bounding boxes for each annotation, that is for each piece of text found, the results give you four Cartesian coordinates that correspond to the x and y pixel locations of four corners of a square that describe where in the frame the text was found. In other words, instead of relying on each data point coincidentally having a different format, I could have used the bounding boxes to query for each data point in a given frame. (Worst. Practices. I literally warned you about this…).
I ran the hash through an each block that will make any programmer cry and ended up with four values for each frame: frame, which represents the frame in seconds, time, or flight time, speed and altitude.
result = []
data.each do |frame_data|
  f = frame_data[0]
  t = frame_data[1].find { |v| v[:text].include?("//") }
  t = t[:text] if t
  s = frame_data[1].find { |v| v[:text].to_i.to_s == v[:text] }
  s = s[:text] if s
  a = frame_data[1].find { |v| v[:text].include?(".") }
  a = a[:text] if a
  result << { frame: f, time: t, speed: s, altitude: a }
end
Looking at this feels embarrassing, but you know what? It worked!
Here’s the same slice of data from above:
[
  # ...snip...
    {:frame=>205.6, :time=>"T+// OO:03:18", :speed=>"7687", :altitude=>nil},
    {:frame=>205.7, :time=>nil, :speed=>"7661", :altitude=>nil},
    {:frame=>206.3, :time=>nil, :speed=>"7677", :altitude=>nil},
    {:frame=>206.4, :time=>nil, :speed=>"7689", :altitude=>"110.0"},
    {:frame=>206.6, :time=>"T+// OO:03:19", :speed=>nil, :altitude=>nil},
    {:frame=>206.8, :time=>nil, :speed=>"7676", :altitude=>nil},
    {:frame=>207.0, :time=>nil, :speed=>"7656", :altitude=>nil},
    {:frame=>207.1, :time=>nil, :speed=>"7647", :altitude=>nil},
    {:frame=>207.3, :time=>nil, :speed=>"7649", :altitude=>nil},
    {:frame=>207.4, :time=>nil, :speed=>"7657", :altitude=>nil},
    {:frame=>207.5, :time=>nil, :speed=>"7669", :altitude=>nil}
  # ...snip...
]
Now, all I had to do was clean up the T+// from the timestamp and ship this off to a CSV!
The Results
You can view the entire dataset on Google Sheets here.
This is kind of where my armchair engineering stopped. I mean, I don’t really know much about rockets, I just love data! (I also love rockets, but I just don’t know enough to make guesses as to what happened). I shared this data with my rocket-knowing friends to see if they could make anything of it.
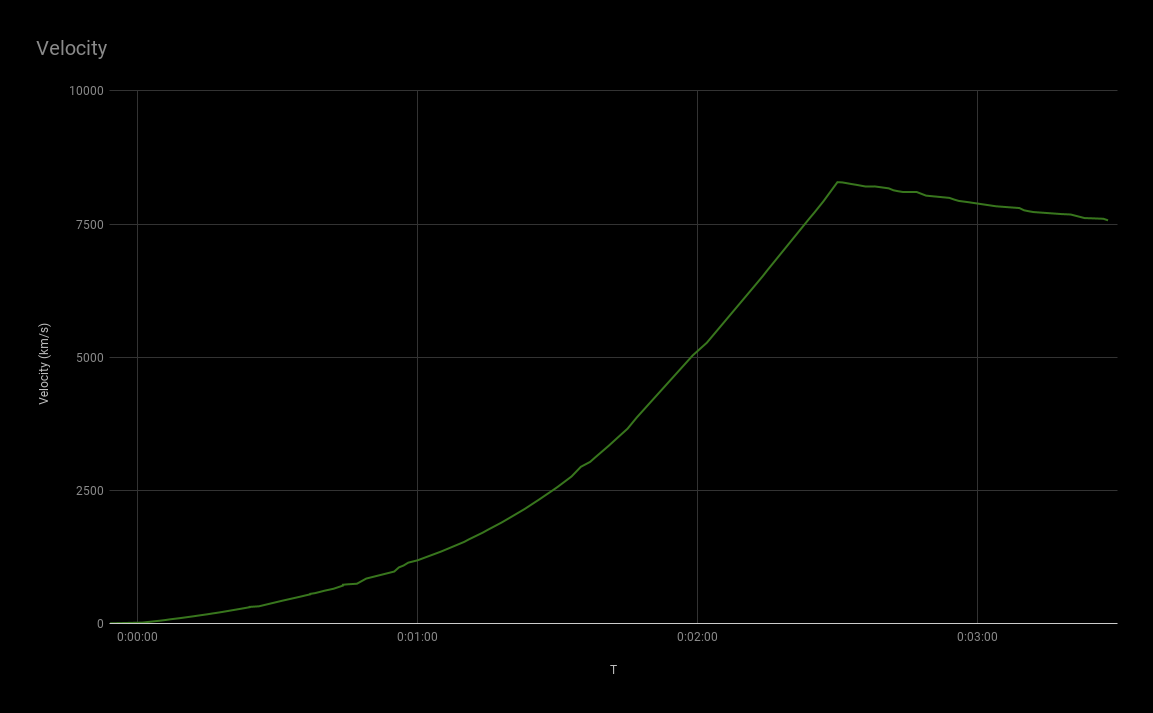
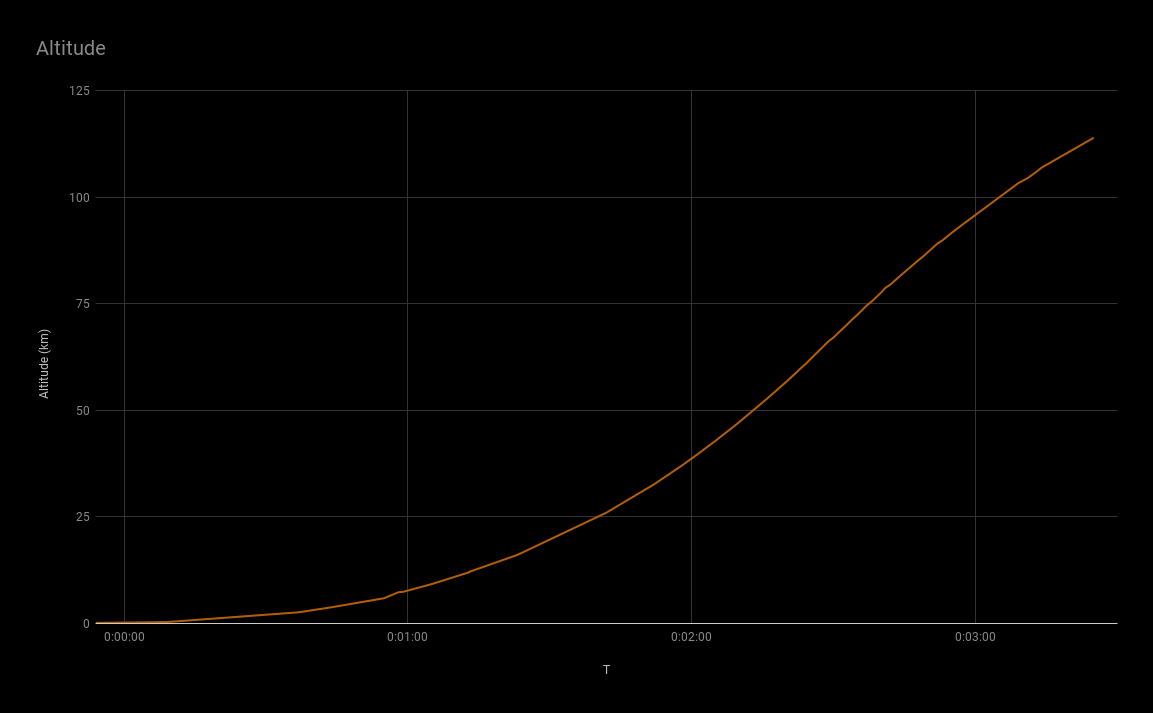
What I do know is that things shouldn’t have ended around T+00:03:30 and that the green line (velocity) should have kept going up, but around T+00:02:30, right around main engine cut off and stage separation, it started going down and stayed down.
Conclusion
This was a fun project from a bad day. It really illustrates to me the power of motivation. This isn’t too dissimilar to my day job, but at work, I can’t just spin up cloud resources and the scale of the data is too large to try to manipulate in memory. That said, it was really fun to try to dive head first into a problem and come out on the other side having learned more about Google Cloud, jq, rocket trajectories, and basic data manipulation.
If I were to approach this problem again, I would keep the rotatedBoundingBox data and use it to identify the meaning of the data. SpaceX’s Falcon 9 streams, for example, contain two readouts each of speed and altitude, one for the first and second stages. It would be impossible to distinguish between the two on format alone.
Secondly, I’d get the data in SQL database right away (or at least store it somewhere where I can use a SQL-like API). Maybe I should up my data game, but my brain likes to think in SQL for problems like these; having to think procedurally in a loop was unintuitive for me.
Thanks for reading! Let me know what you think or if you have any questions. Would you be interested in having raw telemetry data formatted and presented after a launch stream? I’m certainly impressed by the quality of the data coming through! See if you can spot MAX-Q in the velocity graph!